No matter where you have come from, you are welcome!
But you need to know that what you see here is attempting to serve two audiences. If a bit seems odd to you, just skip over it! If you didn't come from one of the following, you may wish to go there, see what is meant to come before what follows first.... but you shouldn't need to, if you aren't inclined. In particular, note that you can get benefit from this page without going into any of the programming issues.
First route to this page: From my "Programming Challenges" page, introducing a protractor-less way to draw angles, as illustrated by drawing angles to make a map.
Second route to this page: From my started- before- December 1999 page about making maps as a hobbyist, with do- it- yourself methods and a home made theolodite. Anorak? Maybe. But Anoraks sometimes have a lot of fun.
The second programming challenge is as follows:
This is a great deal more complicated than the first challenge, not least because I am leaving much of the design to you. If you do anything interesting with this idea, and write it up on the web, I would be glad to publish a link to your work from here.
The application should plot points on a surface, based on measurements of angles made in the real world.
I suggest you tackle it as follows...
First catch your data. A surveyor has to go out into the field, with a theodolite. (An instrument for measuring angles.)
In a perfect world, the data would be delivered in a simple form, all referenced from zero and expressed in degrees, i.e. be like the data we had for our little map of the four sided field, above. And all of the points on the map would be "named" with just a letter. And all angle names, and angle measurements done either clockwise, or counter-clockwise, but not in a mishmashed mixture!
So. You have some data. You should think very hard about how that data will be supplied to your application.
Now, the user of the application would say "Start with these two points". (And the user needs to be able to tell the computer which two he means.)
The sensible pair to use would be the two at the ends of the measured distance, and the angles with their apices there should be measured especially carefully.
The user would tell the app the dimensions of the "piece of paper" he wanted the map on, and where to place the first two points on the map. Except that you may make it impossible to show all of your other points on the page, those first two points can go anywhere. The distance between them determines the scale of the map.
Here's were things start getting tricky.
The next step would be to plot a third point. Which one? Well... that depends. If you have learnt craftsmanship, you will probably be able to "feel" which points would be good candidates. You might be able to train the computer to help you make the choice.
Having chosen which point you will plot next on your map, you tell the computer your choice. At this point, the computer should draw in any angles it can (from the available data) which involve the points you started with and the point you are now trying to place. This should result in two or more lines passing near a new point. From the names of the angles, the human should be able to see what point that is. The program should make it easy to view places lines cross, and to know the names of the lines involved. (I see zooming and panning and dynamic line re-labeling as parts of the elegant solution.)
At this stage, at the level that makes this programming challenge interesting but not exceptionally difficult, it takes, I think human input to say "Put that point there".
Ta da! Your map should now have three points on it.
Now you tell the computer which point you would like to plot next. And this time you let it utilize the data collected in the field, the two points you started the process with, and the location of the third point, which you determined a moment ago. (I.e. in this "Step 2", you take the result of "Step 1" as one of your givens.)
If you've done good work in the field, and if you have chosen the sequence for point plotting well, when you say "Next, I will plot point F", you will find lots of lines appearing on the map. Not only should you have lines arising from FAB and FBA, but, if C was the third point you plotted, and you made some angle measurements from C, you would also have lines from FCA and FCB! And if your measurements, in the field, and while drawing, were good, then all four of the lines will cross at a single point, and now you know where "F" goes on your map!
Repeat many times, once for each point for which you have data.... and you will eventually have a map!
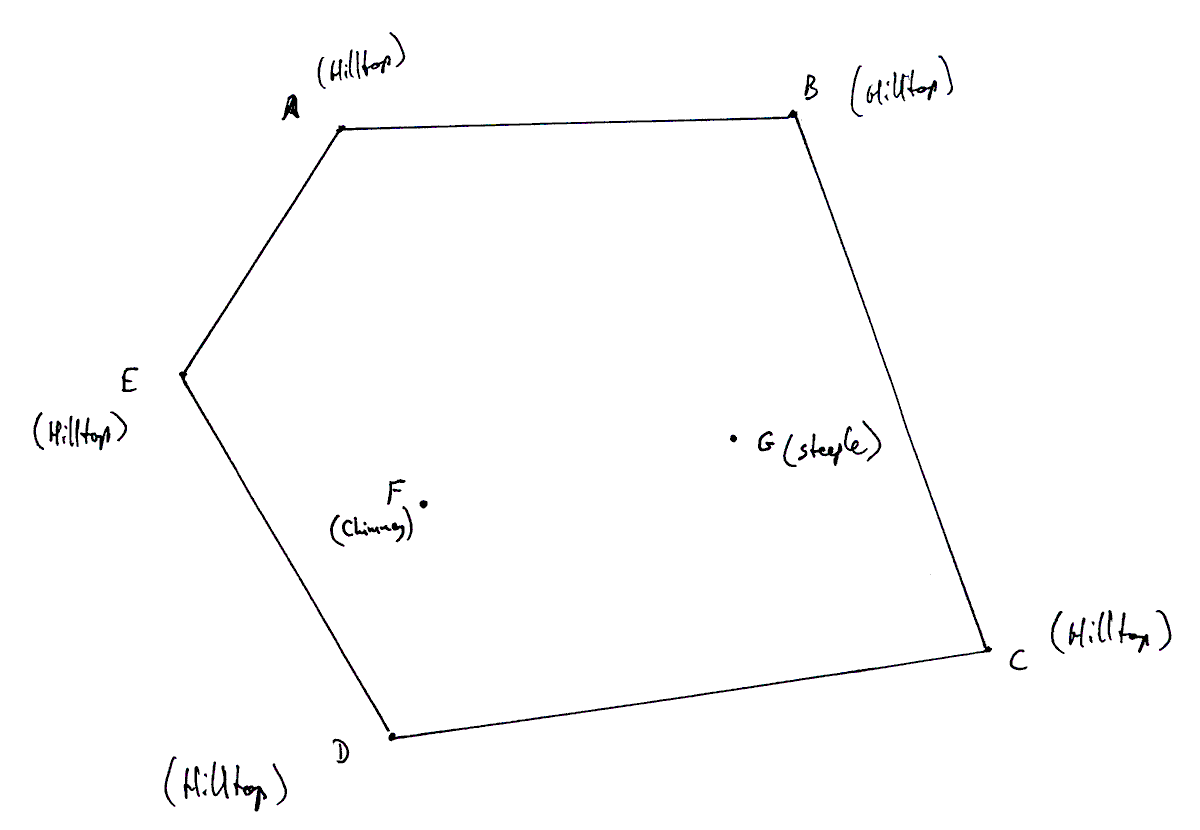
"Here's one I did earlier"... it is a map showing five hilltops (A-E) surrounding a valley, in which there is a chimney. We will call its location point "F". And there is a steeple, point "G".
As I said... things will be easier if your angles are all in degrees, names and measurements are all done "clockwise". For extra credit, build a more realistic application which can accept the data as shown in the "What the surveyor provided..." section. But, for a variety of good reasons, first re-organize it, to be like the data shown in the first table below. This organization takes care of many things for you. The data in the first table is the same as that in the second, other than how it is set out, and the units of angle measurement used.
Angle	Measures
BAE	123
CAE	84
DAE	38
BAC	40
BAD	85
CBA	107.5
DBA	56
EBA	21.5
DCB	80
EDC	112.5
AED	125
(Note A)
BAF	78.5
BAG	39
FBA	45
GBA	87
(Note B)
DCG	49
FCA	127
FCB	62
Calibration of my theodolite: I went to a big field, set out three markers in a line X, Y and Z. I made sure that Y (between X and Z) was on the line between X and Z. I went to Y, with my theodolite, set it up. When I lined it up on X, the pointer read 005. I then, without moving the angle measuring scale, lined it up on Z. Now the pointer read 289. In other words, my theodolite, with its scale, divides 180 degrees into 284 units.
(Of course: If you go out an buy a theodolite, its scale will be divided into degrees. But if you want to make your own(!), then you may be able to do a better job of it if you give up the idea of marking its scale in degrees. Hence the introduction here of the extra problem.)
Then I went to the top of the hilltop to the northwest of the valley, which I will call "A", and set up my equipment. When I had done that, and lined up the sight on hilltop "B", the pointer was on 243.3. Without moving the scale, I lined the sight up on hilltop "C", and the pointer was now on 179.9.
When I sighted towards "D", the pointer was on 110.4
When I sighted towards "E", the pointer was on 50.5
When I sighted towards "F", the pointer was on 121.5
When I sighted towards "G", the pointer was on 181.4
In a more concise form the above can be reported as follows:
From A, to...
       B	243.3
       C	179.9
       D	110.4
       E	50.5
       F	121.5
       G	181.4
After taking the measurements from "A", I went on to hilltop "B". From there....
From B, to...
       A	63.1
       C	231.9
       D	149.9
       E	96.2
       F	132.5
       G	184.3
After taking the measurements from "B", I went on to hilltop "C". From there....
From C, to...
       A	82.2
       B	31.6
       D	155.1
       E	113.6
       F	119.9
       G	80.3
And that will suffice. It is no longer our hypothetical surveyor talking to us. The page's editor is back.
Good luck! The application proposed would not be a trivial undertaking... but even planning how you might go about it could be a useful learning experience. You might want to work up just bits of the overall package, to see if you can "make them work".
Did you notice the rather neat thing that arises when making maps this way? We don't need to visit F or G to put them on the map, as long as we can visit two points from which we can see each of them. We also must be able to see the other "measure from" point from each of the measure-from points. (Otherwise, how do we measure an angle?)
As I said at the top of the page, you may have arrived here from either of two places.
First route to this page: From my "Programming Challenges" page, introducing a protractor-less way to draw angles, as illustrated by drawing angles to make a map. If you came from there, the above was just the "bottom part" of that page, and you are "done"... but the link in this paragraph will take you back, if you want to review something. (Done, that is, of course, apart from writing (should that be wrighting, as my fingers tried to make it? Wheel-wright, ship-wright, program-wright?) the program, posting an account of your work online, and sending me the link for publicity?)
Second route to this page: From my started- before- December 1999 page about making maps as a hobbyist, with do- it- yourself methods and a home made theolodite. Anorak? Maybe. But Anoraks sometimes have a lot of fun.
Have you heard of Flattr? Great new idea to make it easy for you to send small thank you$ to people who provide Good Stuff on the web. If you want to send $$erious thank yous, there are better ways, but for a small "tip" here and there, Flattr ticks a lot of boxes which no one else has found a way to do yet. Please at least check out my introduction to Flattr, if you haven't heard of it? "No obligation", as they say!
Part 2, programming challenge/ map drawing/ drawing angles.Search across all my sites with the Google search button at the top of the page the link will take you to.
Or...
Search just this site without using forms,
Or... again to search just this site, use...
The search engine merely looks for the words you type, so....
*! Spell them properly !*
Don't bother with "How do I get rich?" That will merely return pages with "how", "do", "I", "get" and "rich".
I have other sites. My Google custom search button will include things from them....
One of my SheepdogGuides pages.
My site at Arunet.
This page's editor, Tom Boyd, will be pleased if you get in touch by email.
![]() Page tested for compliance with INDUSTRY (not MS-only) standards, using the free, publicly accessible validator at validator.w3.org. Mostly passes. There were two "unknown attributes" in Google+ button code plus 4 in the Flattr. Sigh.
Page tested for compliance with INDUSTRY (not MS-only) standards, using the free, publicly accessible validator at validator.w3.org. Mostly passes. There were two "unknown attributes" in Google+ button code plus 4 in the Flattr. Sigh.